Droople App
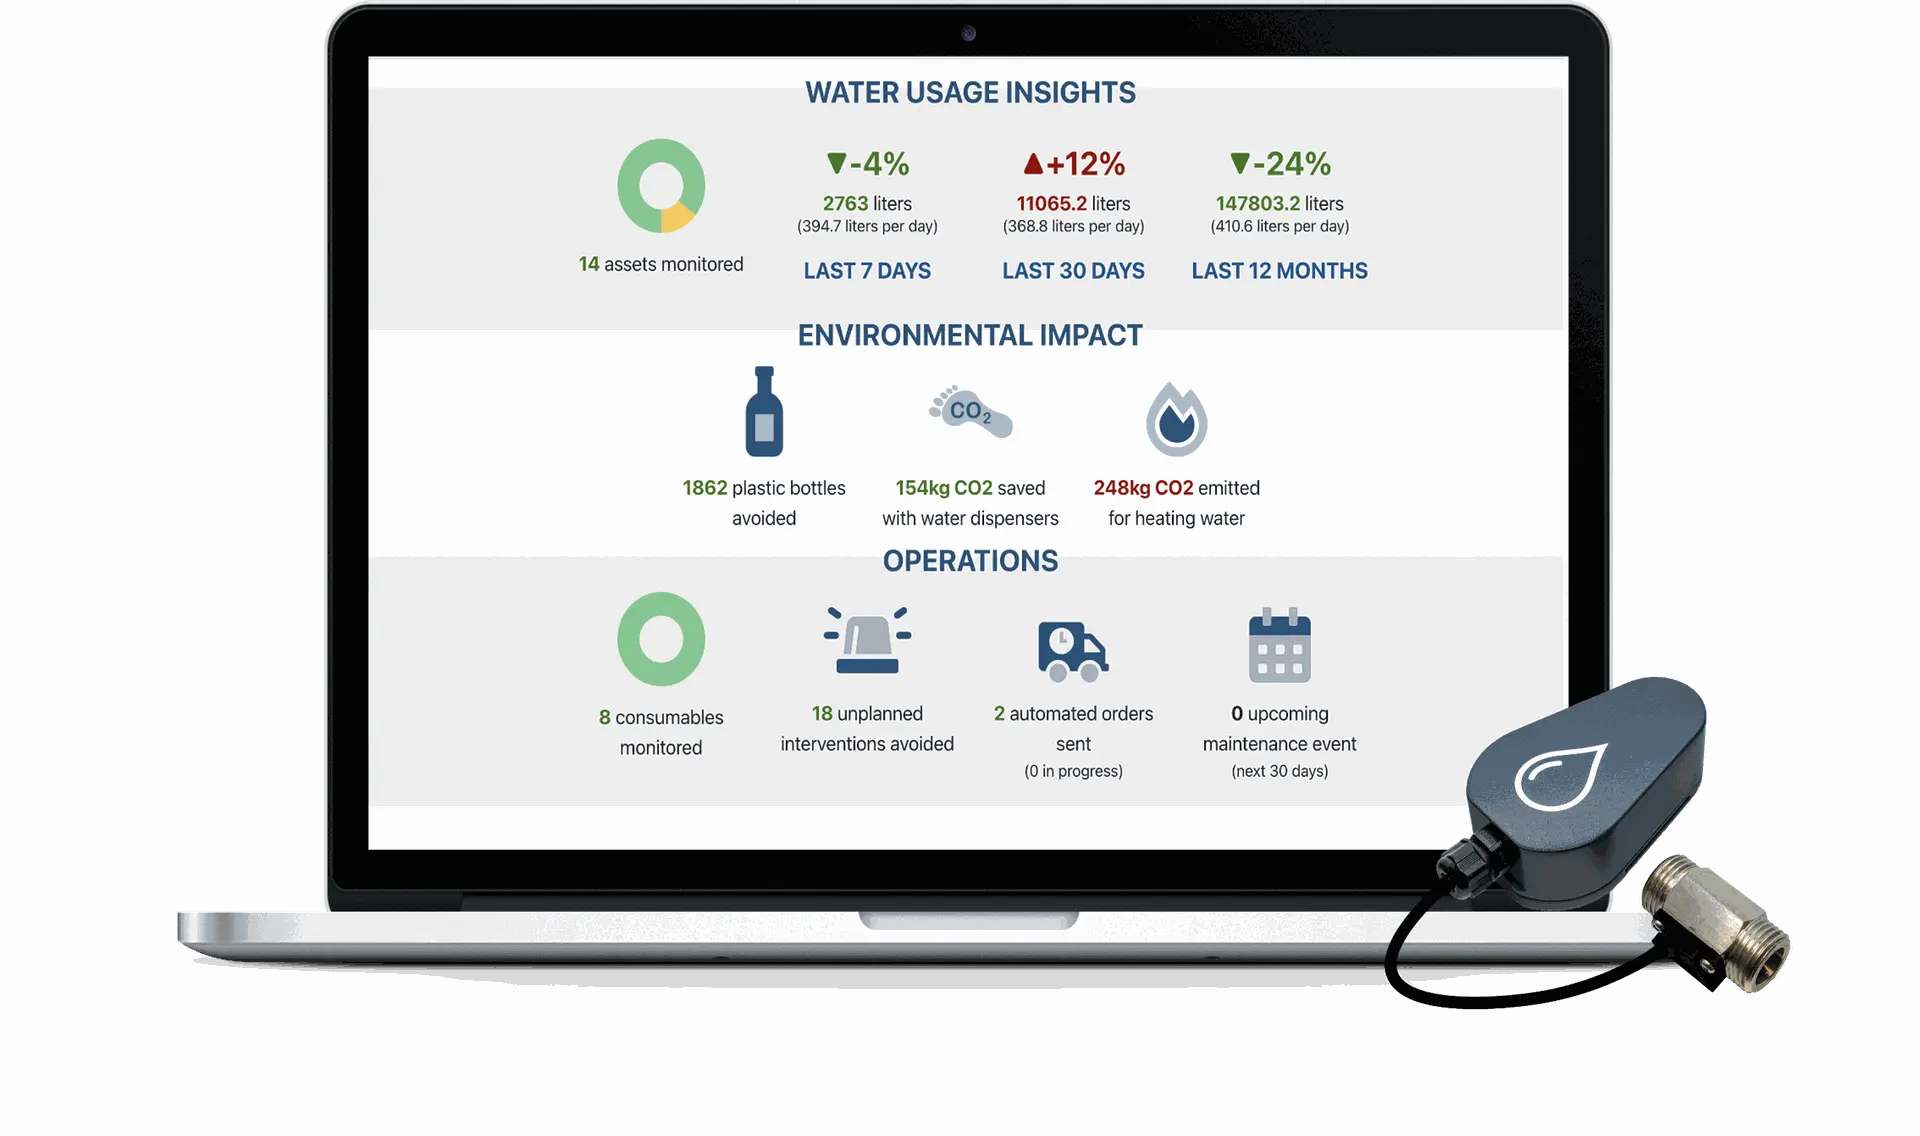
This is where it all happens. The Droople App is your central hub for viewing, managing, and analyzing all your data in real-time. With intuitive dashboards and powerful insights, you'll have complete visibility into your system's performance.
Monitor everything from sensor data to system health, and easily access key metrics that help you make data-driven decisions. Whether you're managing a single device or an entire network, the Droople Platform puts the power of data at your fingertips.
Start exploring now and unlock the full potential of your system!
To access the Droople Platform, simply log in with your registered credentials at app.droople.com. If you're a new user, create an account to get started and receive access to all your data and system settings.
Once logged in, you'll be greeted with an intuitive dashboard. This is your command center for monitoring sensor data, managing devices, and viewing system performance.
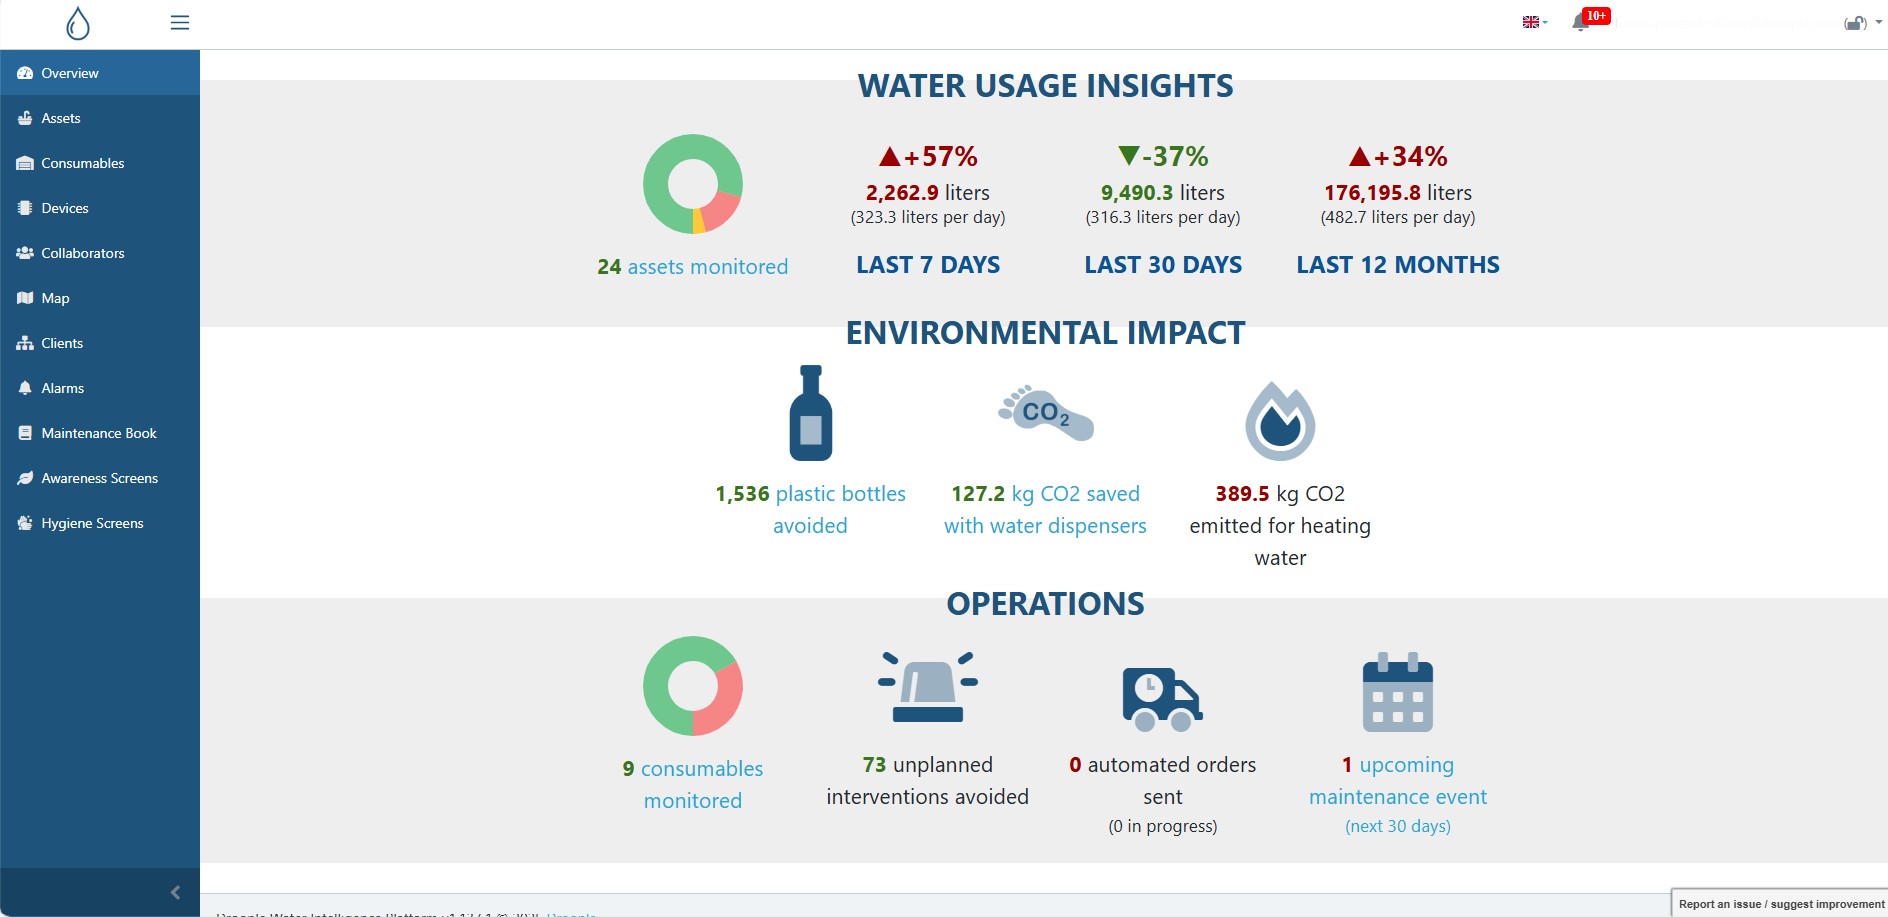
The platform’s layout is user-friendly and organized for easy access to your data. On the left-hand side, you’ll find the main navigation menu with key sections such as:
- Assets
- An asset refers to the client’s equipment on which a Droople iLink device is installed. This can include any system or machine being monitored and managed through the Droople platform.
- Consumables
- A consumable is a piece of equipment designed to operate for a limited time before needing replacement, such as filters, cartridges, or other components that require regular maintenance.
- Devices
- A device represents the Droople iLink hardware you have registered on the platform, whether it is currently activated or not. This section allows you to manage, monitor, and configure all your iLink devices.
- Collaborators
- The Collaborators section allows you to add, manage, and oversee team members or external partners who have access to the Droople platform and its data, ensuring efficient teamwork and data sharing.
- Map
- The Map provides a visual overview of all your connected assets and devices, displaying their exact locations for easy management and monitoring across different sites.
- Clients
- In the Clients section, you can manage the information and settings related to the clients you serve, ensuring seamless coordination and personalized service for each customer.
- Alarms
- The Alarms section helps you set up, view, and manage notifications for system anomalies, malfunctions, or maintenance needs, allowing you to respond swiftly to any issues.
- Maintenance Book
- The Maintenance Book acts as a digital logbook for all maintenance activities performed on your assets, devices, and consumables, ensuring proper tracking and scheduling of service operations.
- Awareness Screens
- The Awareness Screens feature allows you to display real-time data, usage metrics, and sustainability insights to promote awareness and encourage responsible usage within your organization or for your clients.
- Hygiene Screens
- The Hygiene Screens provide essential information on hygiene standards, ensuring health and safety through visual displays.
Each section is just a click away, making it simple to monitor and manage your system.
At the top-right corner of the Droople Platform, you’ll find essential tools to personalize your experience and stay updated.
- User Profile
- Manage your account details and settings effortlessly.
- Language Preferences
- Switch between English, French, or German to match your preference.
- Notifications
- Stay informed with real-time alerts on system performance, device status, and important updates.
This section ensures that you have quick access to your personal settings and critical notifications at all times.
The Data Visualization page on the Droople Platform offers a comprehensive view of your system’s data, making it easy to analyze and interpret usage trends over time.
To access data visualization, go to the Assets tab in the left-hand menu and click on the specific asset for which you want to view the data. The type of data displayed will depend on the sensor(s) installed on that asset.
At the top of the page, you’ll find a filtering tool that allows you to select the time period for the data you want to analyze. Choose from predefined options like Last 7 Days, Last Month, or define a custom time frame from hourly to yearly views, including formats such as Raw, Hourly, Daily, Weekly, Monthly, and Yearly data points.
Don’t forget to click the Reload button after setting your filters to refresh the data displayed.

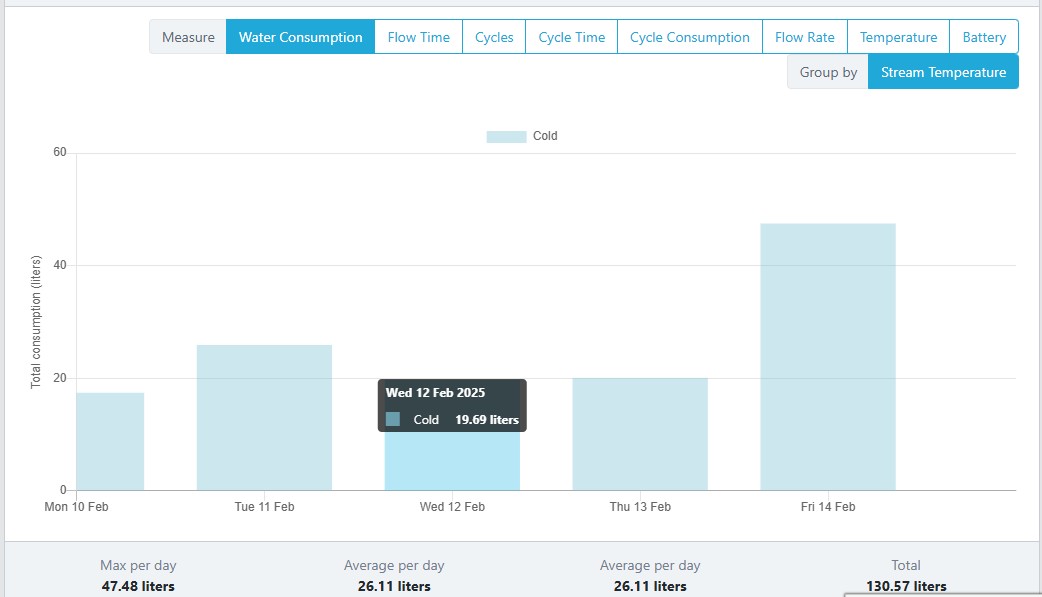
Below the filter, the page displays key metrics for the selected period, followed by an interactive graph. This graph allows you to visualize specific data types such as water flow, temperature, cycles, pressure, and more. Hovering over the graph with your mouse reveals more precise data points, giving you detailed insights at a glance.
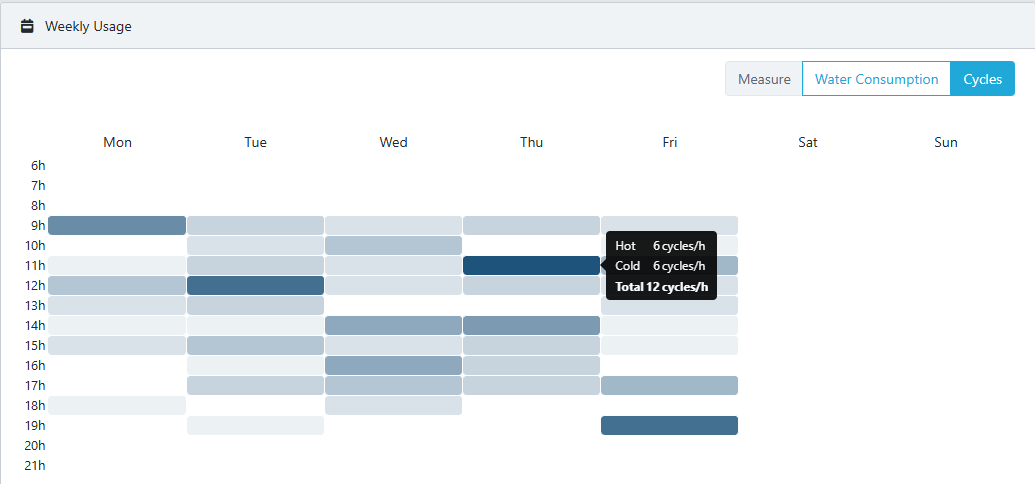
Further down, you'll find the Weekly Usage Graph, which provides a heatmap of water consumption or usage cycles by week. The darker the color, the higher the consumption during that period. Hovering over any section of the heatmap reveals exact usage figures for that week.
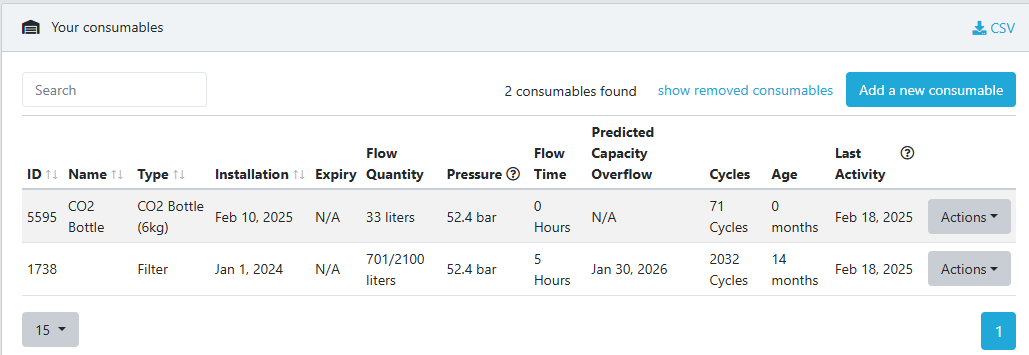
At the bottom of the page, the platform displays any consumables attached to the selected asset, such as filters or CO₂ bottles. Using historical data, the Droople Platform can predict when consumables will need to be replaced, helping you plan maintenance proactively and avoid unexpected downtimes.
With these tools, the Droople Platform ensures that you have all the information you need to monitor, analyze, and manage your water usage efficiently.
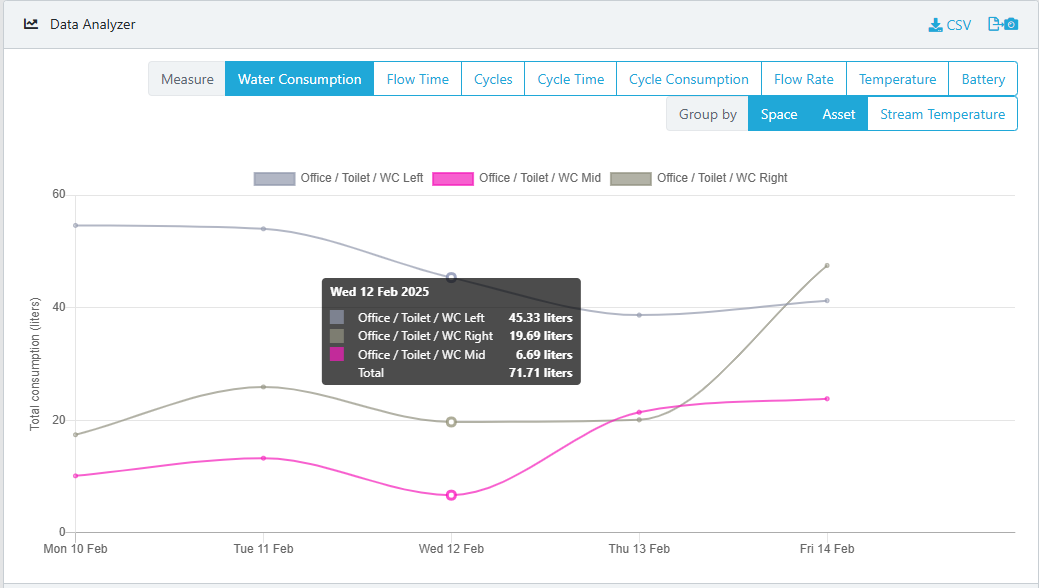
For certain applications, comparing the data from multiple assets can provide valuable insights, and the Droople Platform offers this capability with ease!
To compare asset data:
- Go to the Assets tab in the left-hand menu.
- Select the assets you want to compare by checking the boxes next to each asset.
- Click the Compare Selection button.
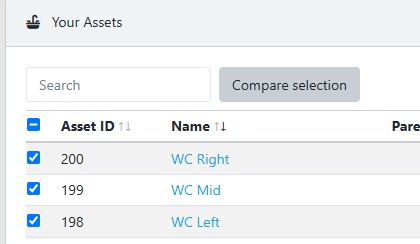
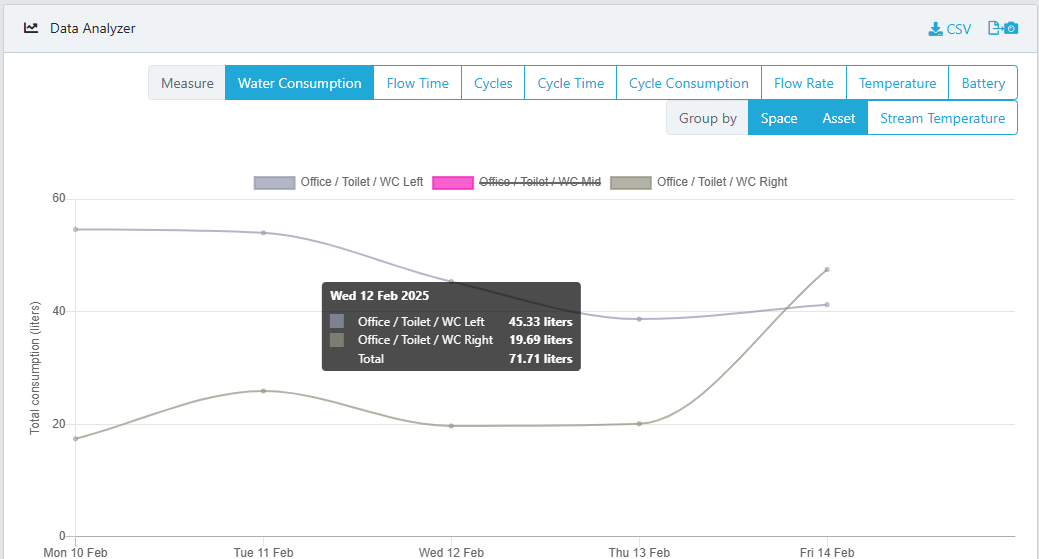
This will open a side by side, making it easy to analyze and identify patterns across your systems. Additionally, you can hide specific assets from the dashboard by simply clicking on the asset’s name within the dashboard, allowing for a more focused view when needed.
The Droople Platform makes it easy to add collaborators to your account, ensuring that the right people have access to the data they need.
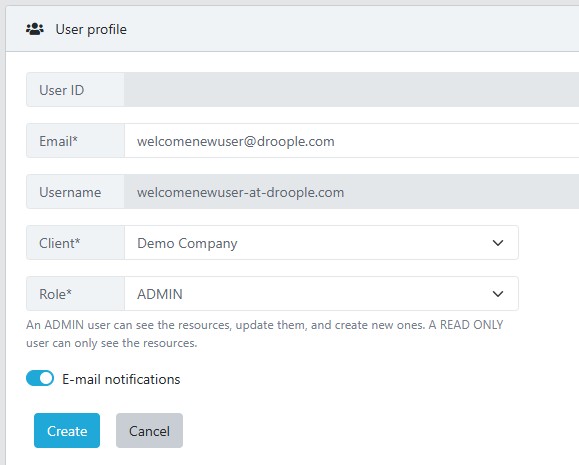
To add a new collaborator:
- Go to the Collaborators tab in the left-hand menu.
- Click the Provision a new user button.
- Enter the email address of the person you want to add.
- If you manage multiple clients, select the client account the user will be attached to.
- Choose the user’s role:
- ADMIN: Full access with the ability to make modifications.
- READ ONLY: View-only access to data, without modification permissions.
- You can also enable notifications for the new collaborator by checking the notification box.
- Click the Create button to finalize the process.
Once created, the collaborator can go to app.droople.com, enter their email address, and complete their account setup by creating a password. After that, they will have access to the selected client account and its data.
The Droople Platform supports a hierarchical structure with Parent and Child accounts, making it easy to manage multiple clients.
- A Parent account can view and manage the data of all its Child accounts.
- Each Child account operates independently but remains accessible to the Parent account.
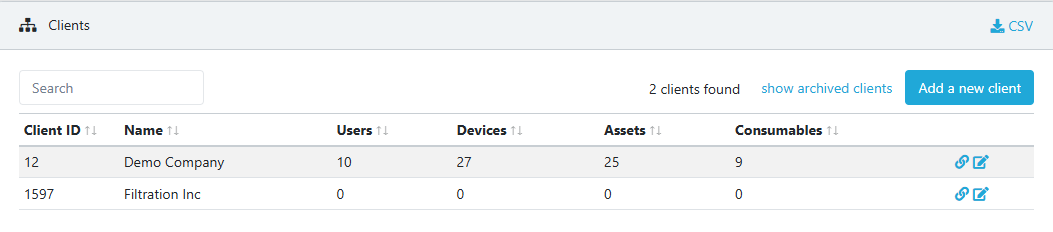
To add a new child client:
- Go to the Clients tab in the left-hand menu.
- Click the Add a new Client button.
- Enter the name of the new client and click Create.
The new Child account will be created under the Parent account automatically.
In the Clients tab, you can also view key information for each account, including:
- The number of Users attached to each client.
- The number of Devices (iLinks) associated with each client.
- The number of Assets linked to each client.
- The number of Consumables linked to each client.
With this structure, the Droople Platform offers flexibility and scalability for managing multiple clients seamlessly.
The Droople Platform offers two methods for creating assets, with the recommended option being through the iLink QR code for a seamless setup experience.
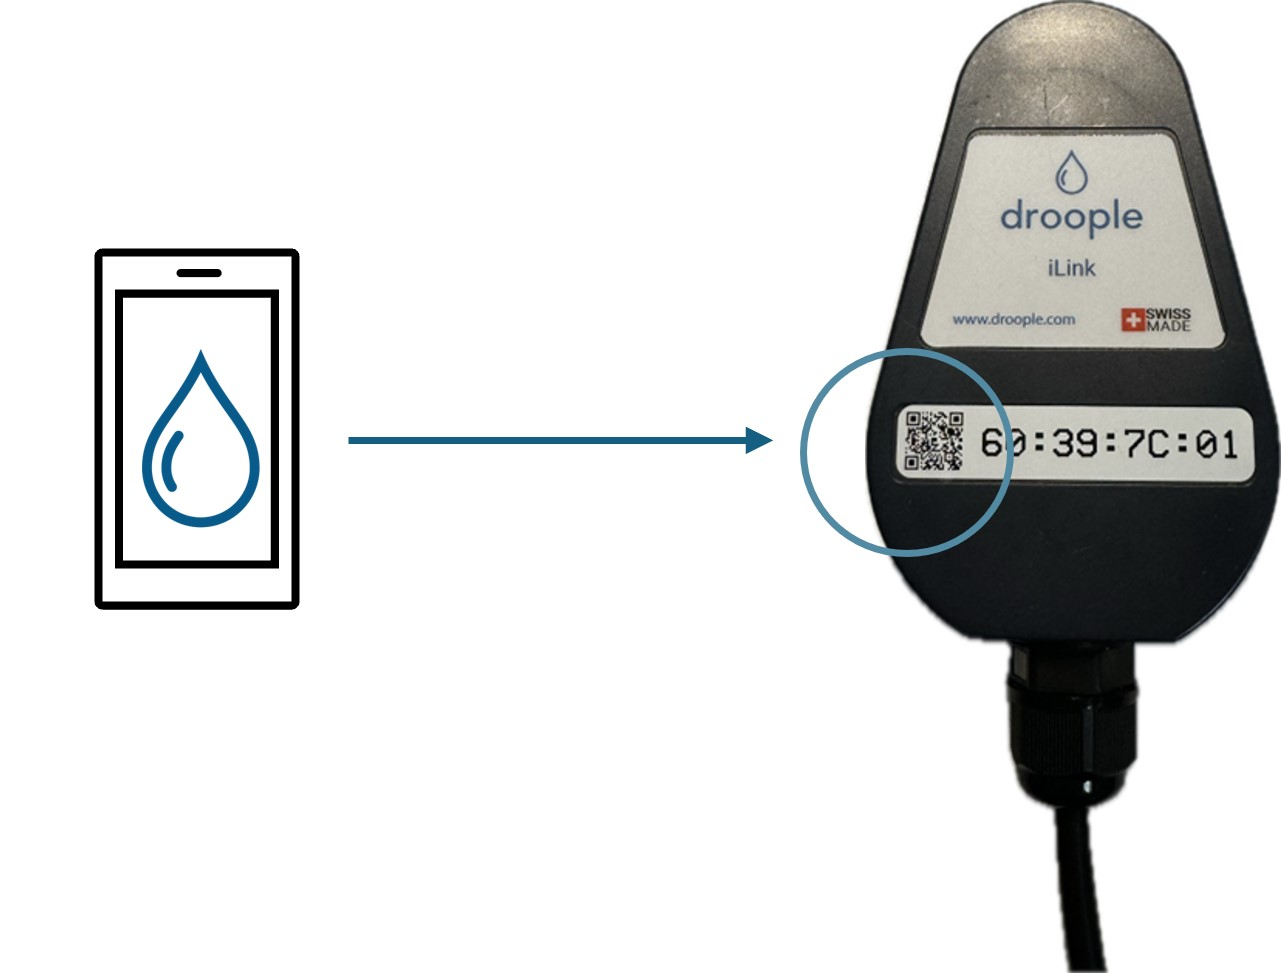
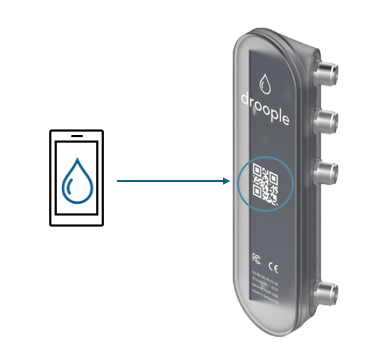
Recommended Method: QR Code Scanning
Using your smartphone, simply scan the QR code located on your iLink device to automatically launch the configuration wizard. This guided process ensures accurate and efficient asset creation.
Manual Method: Creating an Asset via the Platform
Alternatively, you can manually create an asset directly on the platform:
- Go to the Assets tab in the left-hand menu.
- Click the Add a new asset button.
- Define the asset’s name, select the appropriate asset type, assign it to the correct client, and set the timezone.
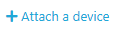
- Click Attach a Device to link your iLink by entering its unique ID number.
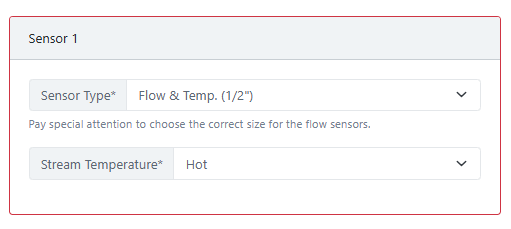
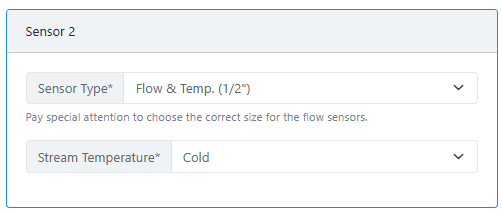
- Note: You can attach up to two devices to each asset if you're using an iLink LoRa device, or one device if you're using an iLink NB-IoT device.
- Select the Sensor Type that matches the installed sensor.
⚠️ It is crucial to select the correct sensor type and size, as any mismatch between the selected sensor and the installed one will result in inaccurate data.
- Finally, click the Create button to complete the asset setup.
Both methods provide flexibility, but using the QR code ensures a smoother and more accurate configuration process. With your assets properly set up, you can begin monitoring and managing your data efficiently through the Droople Platform.
There are two ways to associate consumables with the assets you’ve created:
1. During Asset Creation (Recommended Method)
The easiest way to associate a consumable with an asset is during the asset creation process when using the QR code scanning wizard. This allows you to automatically link a consumable, such as a filter or CO2 bottle, as part of the asset setup.
2. Manually via the Consumables Tab
Alternatively, you can manually associate a consumable to an asset by following these steps:
- Go to the Consumables tab in the left-hand menu.
- Click the Add a new consumable button.
- Fill in the required details:
- Name of the consumable (e.g., Filter, CO2 Bottle)
- Consumable type
- Installation date
- Size (CO2 Bottle)
- Capacity
- Lifetime (this value is provided by the manufacturer before replacement)
- Client
- Associated Asset
Once you’ve completed this, the Droople Platform works its magic, using AI to predict the consumable replacement based on historical consumption data. Whether it's a filter or CO2 bottle, the platform will predict when it’s time for a replacement, helping you stay ahead of maintenance.
Predictive Maintenance with AI
Keep in mind that the platform will need sufficient historical data from the asset to make accurate predictions. As the system gathers more usage data, the predictions will become more refined.
Maintenance Book
All consumable data, along with usage history and predictions, can be easily accessed through the Maintenance Book tab. This digital maintenance log provides you with up-to-date information, ensuring your equipment is always well-maintained and helping you stay on top of necessary replacements.
With these features, the Droople Platform streamlines consumable management, ensuring that you always know when it’s time for a change—before it’s too late!
In the Droople Platform, alarms are an essential part of monitoring your system and ensuring everything is functioning smoothly. Some alarms are pre-configured by default based on the installed sensors, while others can be customized to meet your specific needs.
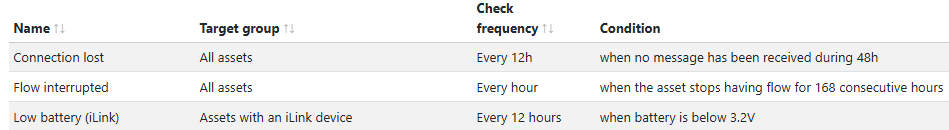
Default Alarms
Certain alarms are automatically set depending on the type of sensors installed in your system. These alarms help ensure that critical issues are immediately flagged for attention.
Creating Custom Alarms
If you wish to create your own custom alarms, you can do so by navigating to the Clients tab:
- Click on the Edit button next to the desired client.
- Here, you’ll find various options to set up custom alarms based on the available criteria.
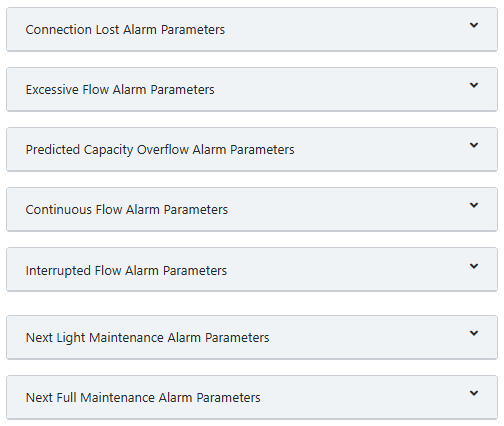
Once your alarms are set, they will be visible in the Alarms tab, where you can monitor their status and see the historical data related to each alarm.
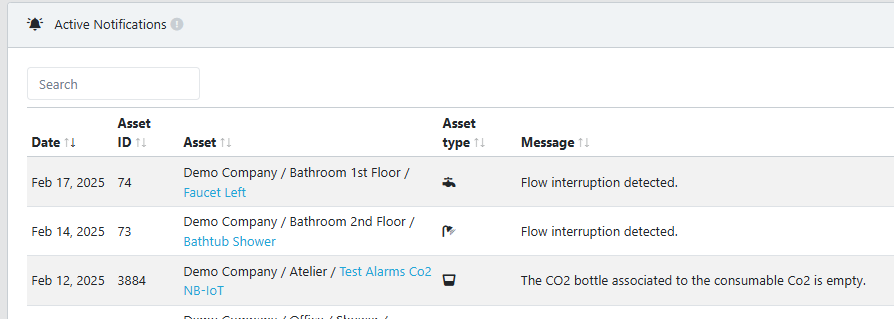
Notifications
If notifications are enabled in your user profile, an email will be sent to the designated person whenever an alarm is triggered. Additionally, you can keep track of alerts through the bell icon located at the top-right of the platform.

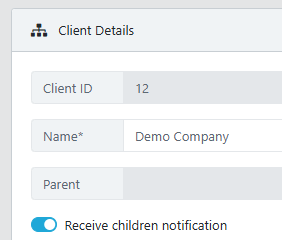
Viewing Alarms for Sub-Accounts
If your user profile is attached to a parent account and you wish to receive alarms for child accounts, make sure the "Receive Children Notifications" option is enabled for the parent account. This allows you to see alarms from all associated child accounts.
Ongoing Improvements
The Droople team is continuously working to improve the alarm system, making it more intuitive and responsive. Future updates may also introduce additional features, including the ability to quantify alarms for even better insights into your system's performance.
The Map tab provides a valuable feature for visualizing the location and status of your assets. If the assets you’ve created are properly configured with an address, they will be displayed on a world map for easy access and monitoring.
View Asset Locations
By using the map, you can see the geographic locations of all your assets in a single view, giving you a clear overview of your system across various sites. This is especially useful for managing multiple assets located in different regions or countries.
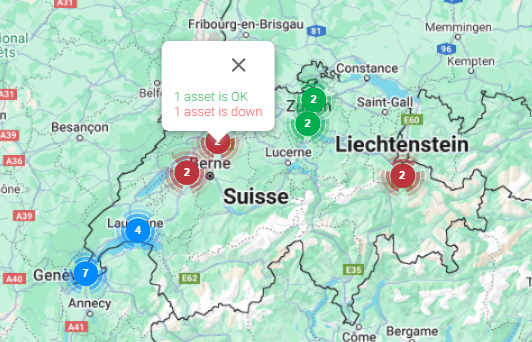
Asset Health at a Glance
The map not only shows the location of each asset but also provides a quick status update on their health. In one glance, you can assess the current condition of your assets without needing to physically visit each site. This allows you to quickly identify any issues and take action as needed.
Easy Access
From the map, you can directly click on any asset to access more detailed information and manage settings. This centralized view helps streamline your workflow and ensures you’re always aware of your assets’ status, no matter where they are located.
The Maintenance Book provides a comprehensive view of all your assets and the associated consumables in a single, easy-to-manage interface. Think of it as your digital maintenance log, streamlining the way you monitor and maintain your system.
Manage Assets and Consumables
Within the Maintenance Book, you can efficiently view and manage all the assets and their linked consumables in one place. It gives you an overview of the current status, usage, and maintenance history of both, helping you stay organized and up-to-date.
Access Consumable Details
By clicking on the small (+) icon next to an asset, you can quickly access details of the consumables attached to it, such as filters, CO2 bottles, and more. This provides you with valuable information on when replacements are needed, ensuring your system operates smoothly.
Perfect for Maintenance Teams
The Maintenance Book is a perfect tool for everyone involved in system maintenance. Whether you are overseeing multiple assets or just managing one, it simplifies tracking and ensures your assets and consumables are always well-maintained and replaced on time.
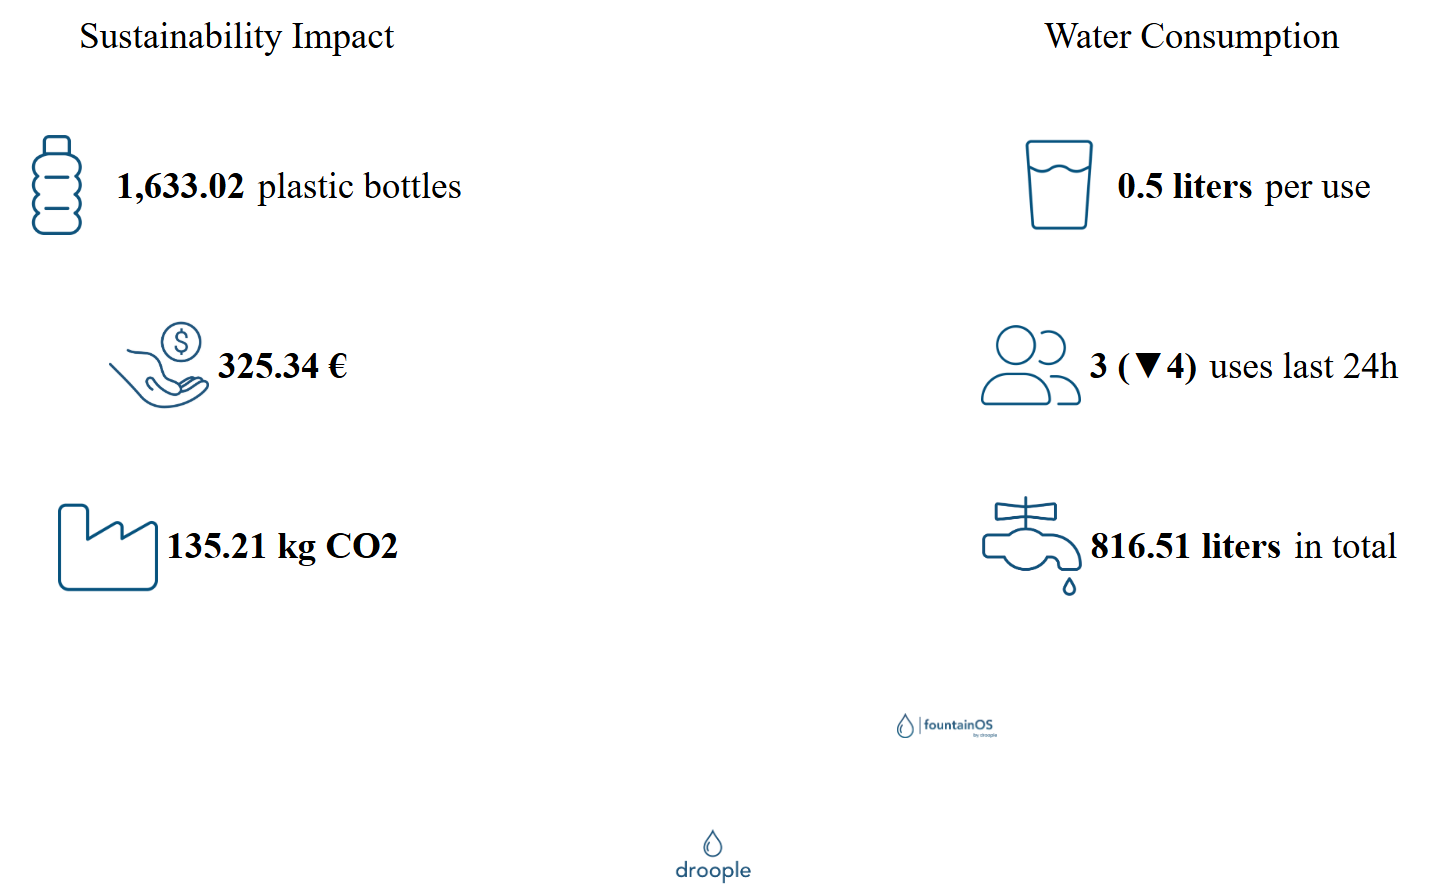
The "Awareness Screen" feature allows you to generate public dashboards displaying data about your assets. These screens can be used to engage users about water consumption and promote water conservation. You can create various types of awareness screens, such as:
- Sustainability impact screens for water dispensers, showing the reduction in plastic bottle usage (FountainOS).
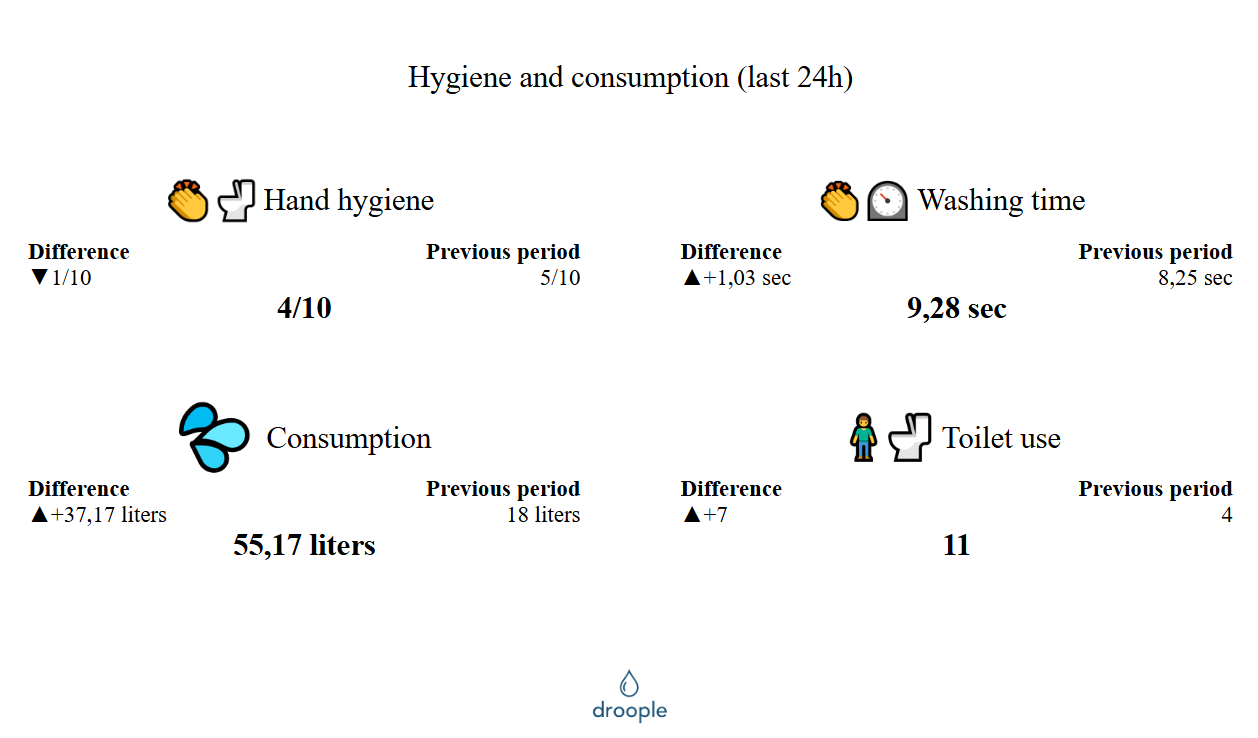
- Hygiene screens for toilet facilities, displaying handwashing times and water usage (SchoolOS).
- Consumption and usage screens for various assets in homes, offices, and other environment
The following features are available for Awareness Screens:
- Fully Parameterized Widgets with an Enhanced Designer: Customize your screen's content and layout with the enhanced designer. Configure data types, icons, text, and time periods.
- Asset Control: Create awareness screens for any asset to showcase your organization's impact.
- "From Activation" Data: Display the cumulative water consumption savings since the equipment's installation, providing a visual representation of your sustainability progress.
- Personalized Templates: Create custom templates to align your awareness screens with your brand and specific needs.
- HTML-Only Public Screens: Ensure compatibility with browsers that have limited JavaScript support. The awareness screen is available in pure HTML, making it viewable on most TVs or screens with a browser.
Managing Awareness Screens
In the "Awareness Screen" menu, you can view, edit, and create new awareness screens from available templates. You can also create custom templates based on existing awareness screens.
Collecting data is important, but showing it is even more powerful. With Droople’s Awareness Screen, you can easily display your data in a visually appealing way that can be shared with your team or displayed for your clients.

Creating a new Awareness Screen
When you create a new awareness screen you can start “from scratch” or use an existing template.
We suggest you start from a template as it will simplify the creation process.
There are multiple existing templates, and you can also create your own templates.

The designer allows you to customize the screen display by selecting the screen design (icons and colors), language (for the units), title (name of the screen), decimal and thousands separator, and screen content (the screen is divided into 4 columns by 5 rows, and each cell can be parameterized to receive a different widget and overflow onto different cells). Once you have designed your screen, you can publish it and view the results, generate a QR code that links directly to your public awareness screen, or obtain a code snippet to embed the awareness screen into your website.

Cell editing allows you to select the widget information, which includes:
- Column and Row spans to resize the widget
- Free text about the widget
- Widget icon, either from a list of existing icons or a user-defined icon from a URL
- Widget type (User defined, Water consumption, Number of uses, Duration of usage, Sustainability impact - Number of bottles, Sustainability impact - Money saved, Sustainability impact - CO2 saved, Hygiene score, Energy to heat water). The User defined type allows for free text or icons.
- Period (Hourly, Daily, Weekly, Monthly, Yearly, From activation, From date) and associated data (average or total, depending on the Period). Daily data can show the difference from the previous period.
You can also select:
- Assets: You can limit the types of assets the widget uses in its calculations. This allows you to, for example, show the difference in consumption between asset types.
- Parameters: You can set parameters for the widget, such as units or other parameters used for calculations.
Fountain OS
School OS
To personalize your experience and align the Droople Platform with your brand, you have the option to replace the Droople logo on the login page and throughout the platform with your own company’s logo.
How to Replace the Logo
Follow these simple steps:
- Go to the Clients tab.
- Click on Edit next to your client account.
- Navigate to the Customization section.
- In this section, you’ll find a field where you can input the URL of the logo you wish to use.
- After entering the logo URL, click the Update button to save the changes.
Once updated, your logo will replace the default Droople logo on the login page and throughout the platform, providing a consistent and branded user experience for your team and clients.
EvercleanOS is a solution developed by Droople to optimize cleaning schedules through the collection of restroom usage data. By analyzing daily usage patterns, EvercleanOS calculates optimal cleaning times based on a maximum allowed number of visits between cleanings. This threshold is customizable for each space according to service agent feedback.
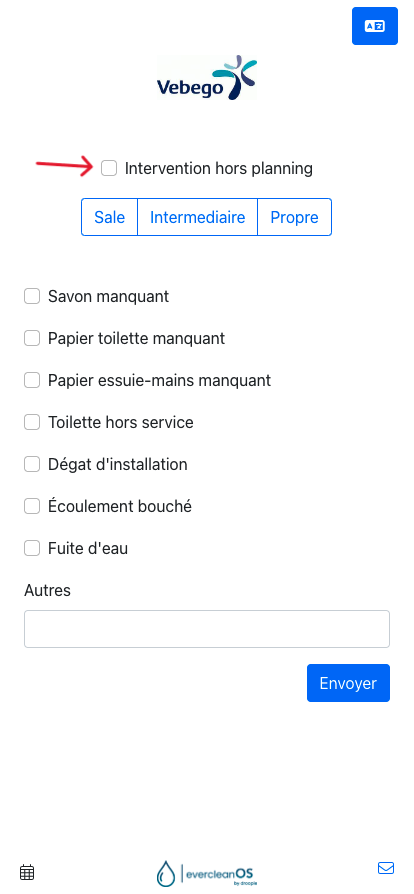
Smart Scheduling and QR Code Integration
When service agents scan the QR code, they can input the current state of the space. The system matches the scan with the closest scheduled cleaning time and updates the cleaning schedule, ensuring accuracy even if scans are not performed exactly on time. Agents can also mark scans as 'Out-of-Schedule Interventions.'
Example
If an area is cleaned at 6 AM (not part of the Everclean schedule) and the next scheduled cleanings are at 9 AM and 10:30 AM:
If marked as out-of-schedule: The last clean is shown as 6 AM and the next as 9 AM.
If not marked as out-of-schedule: The system assigns the scan to the 9 AM cleaning, making the next clean at 10:30 AM.
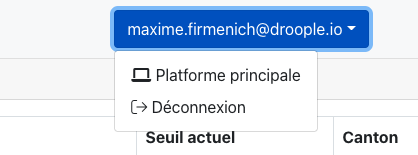
Home Page Features
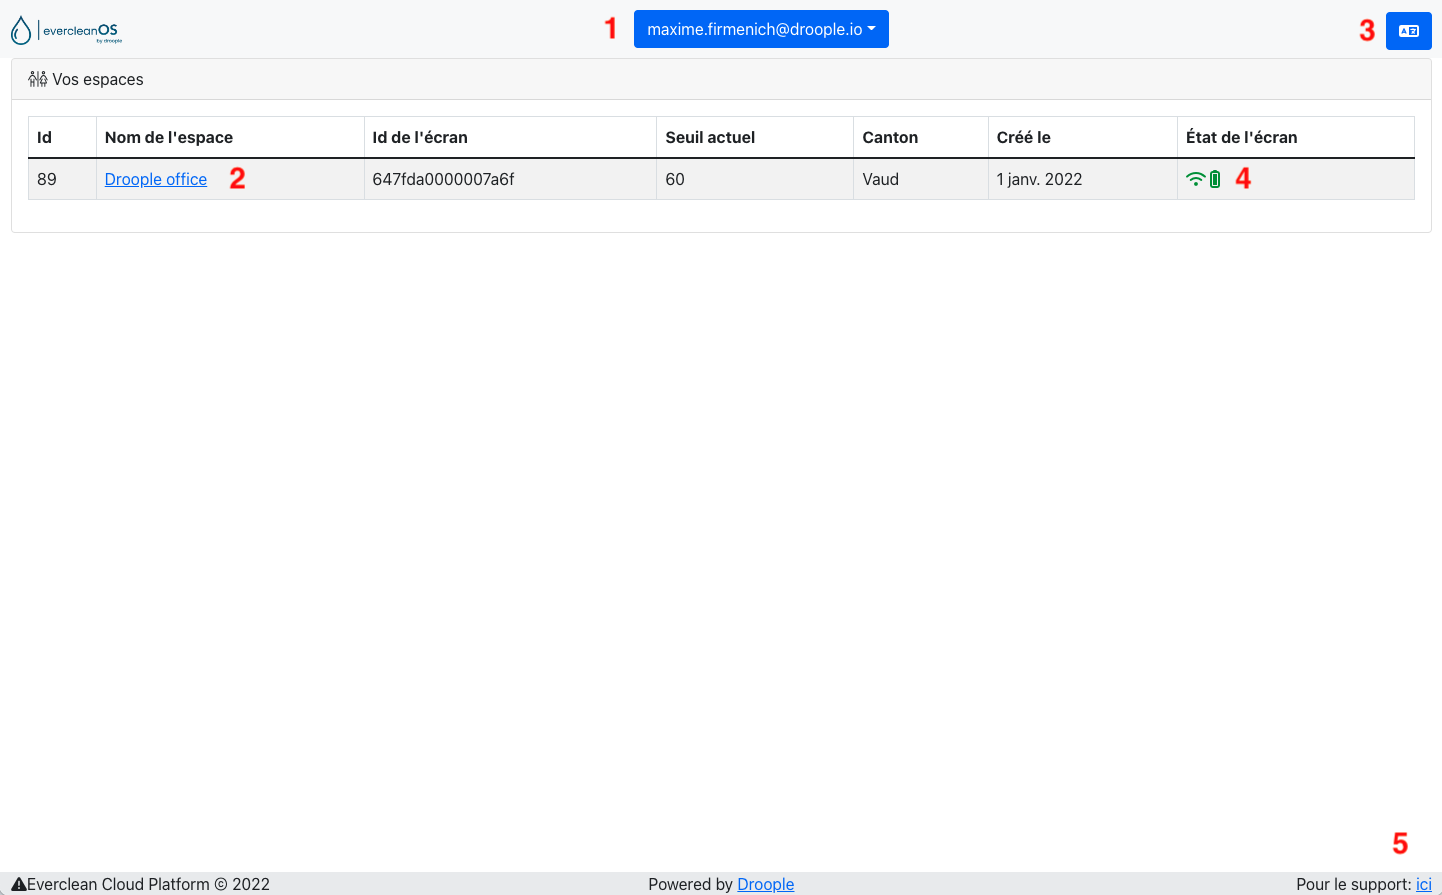
- My Account: Logout or access the main Droople platform.
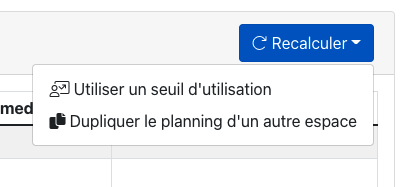
- My Spaces: View system-calculated cleaning times and adjust usage thresholds or duplicate schedules.
- Language Change: Switch between French and German.
- Screen Status: Check the status of your screen.
- Support Contact: Reach out to Droople support.
Additional Features
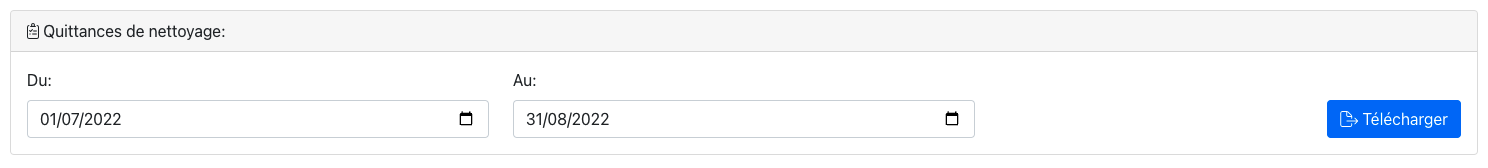
- Download cleaning reports with service agent feedback in CSV format.
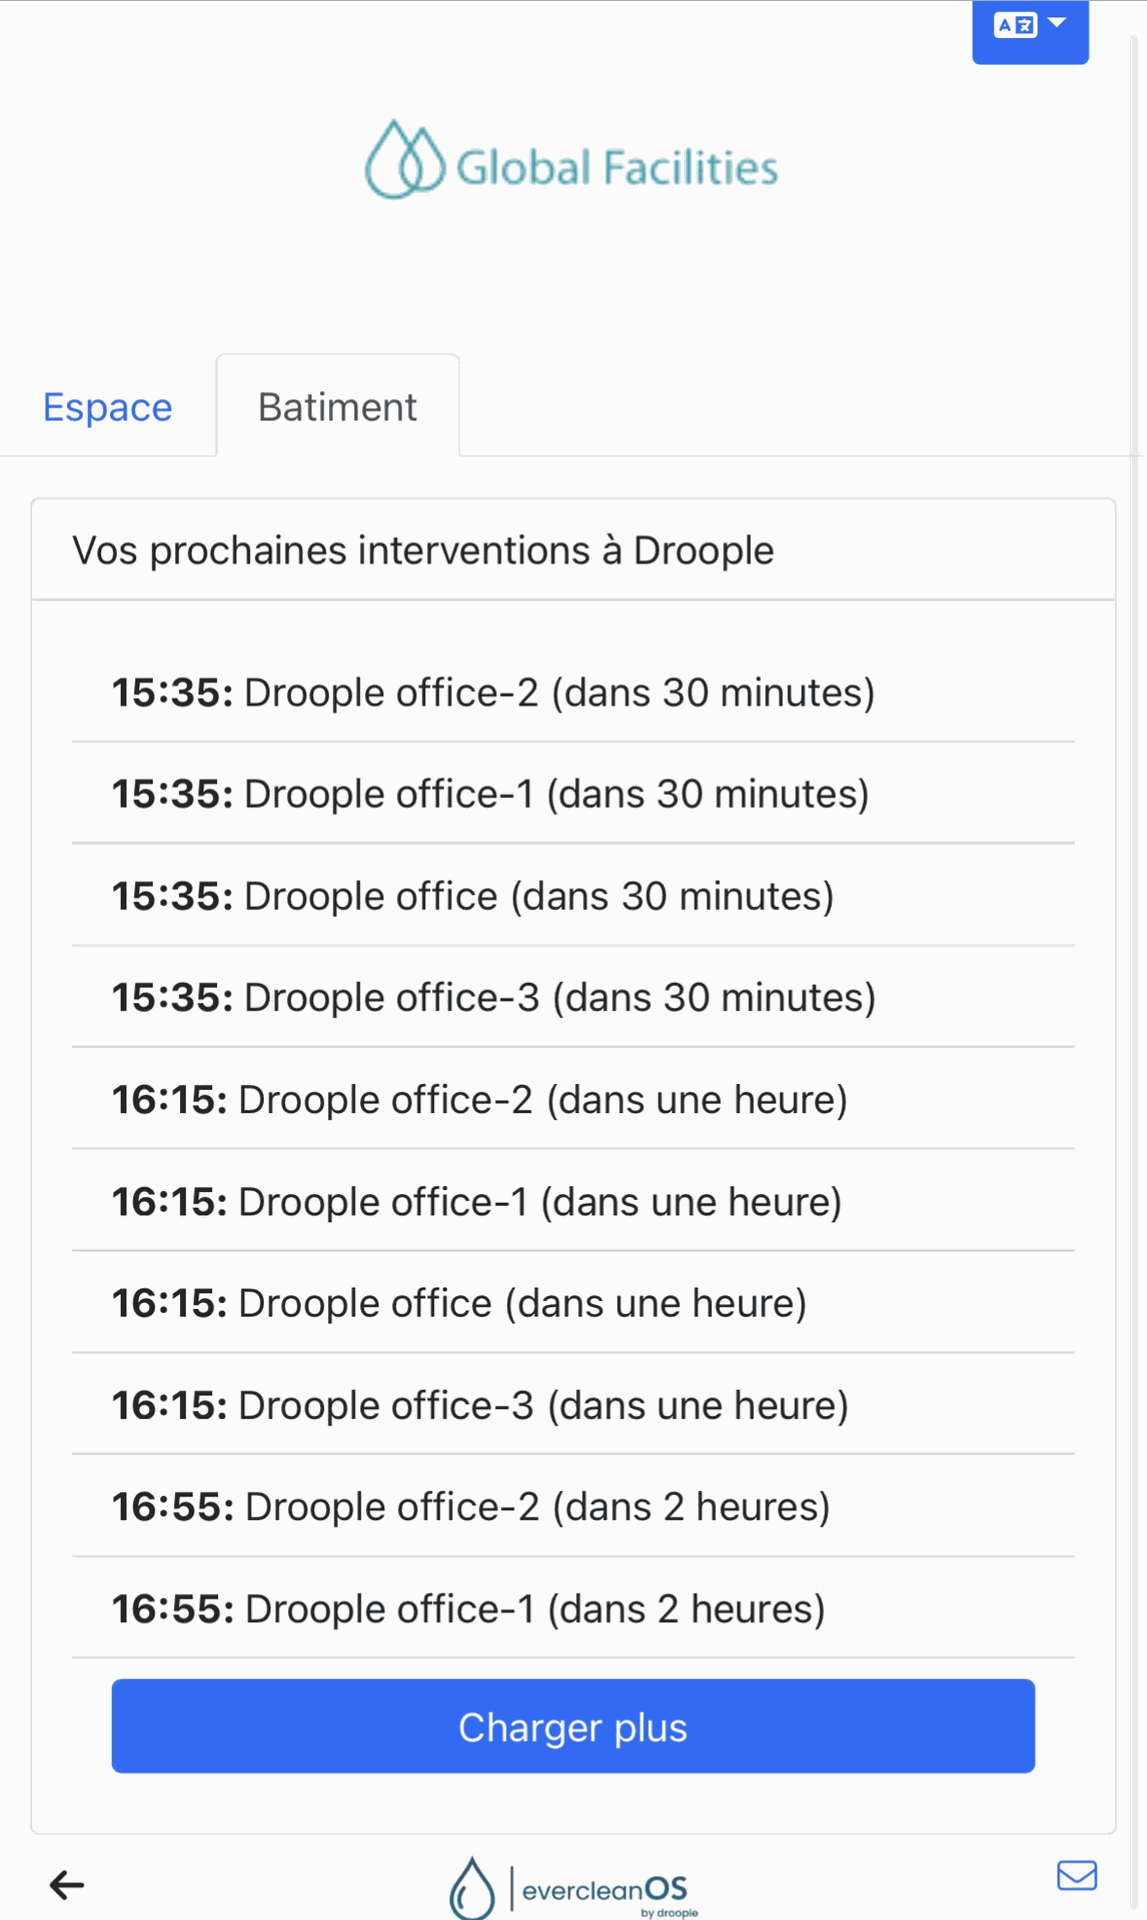
- View upcoming cleaning schedules by scanning the QR code or accessing the building-wide schedule.
EvercleanOS ensures efficient, data-driven cleaning management, enhancing hygiene standards while optimizing maintenance operations.
EvercleanOS User Guide
- My Account: Click on your email at the top of the page to log out or access the main Droople platform.
- My Space(s): Clicking on one of your spaces displays the cleaning schedules calculated by our system.
- Recalculate: Adjust the cleaning schedule by changing the usage threshold or duplicating the schedule from another nearby space (e.g., men’s and women’s restrooms).
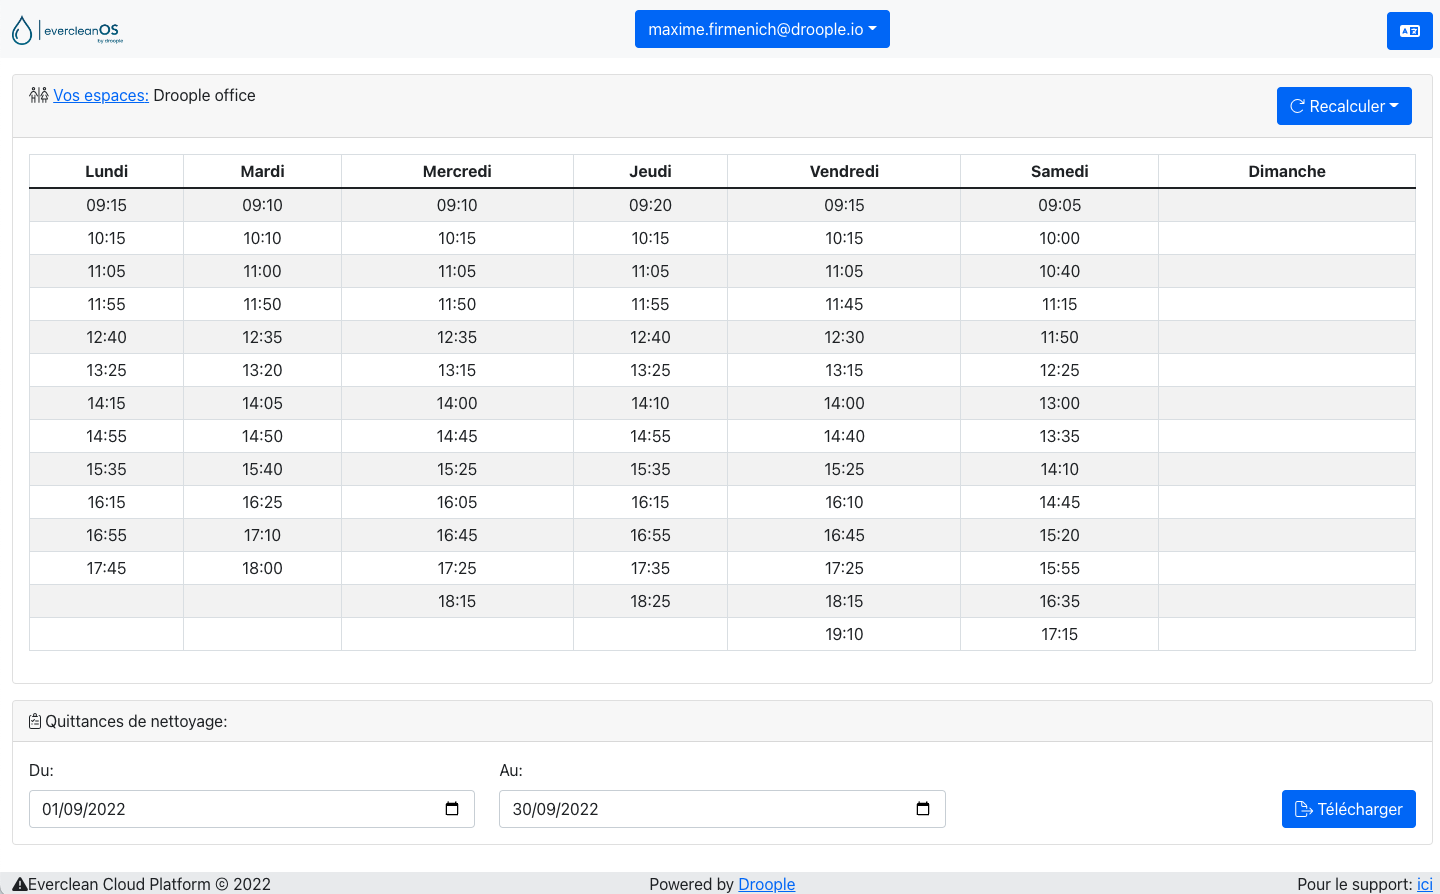
- You can also download cleaning receipts with service agent feedback in CSV format by specifying the desired dates.
Viewing Cleaning Schedules:
- Scan the QR code of a screen in one of your spaces.
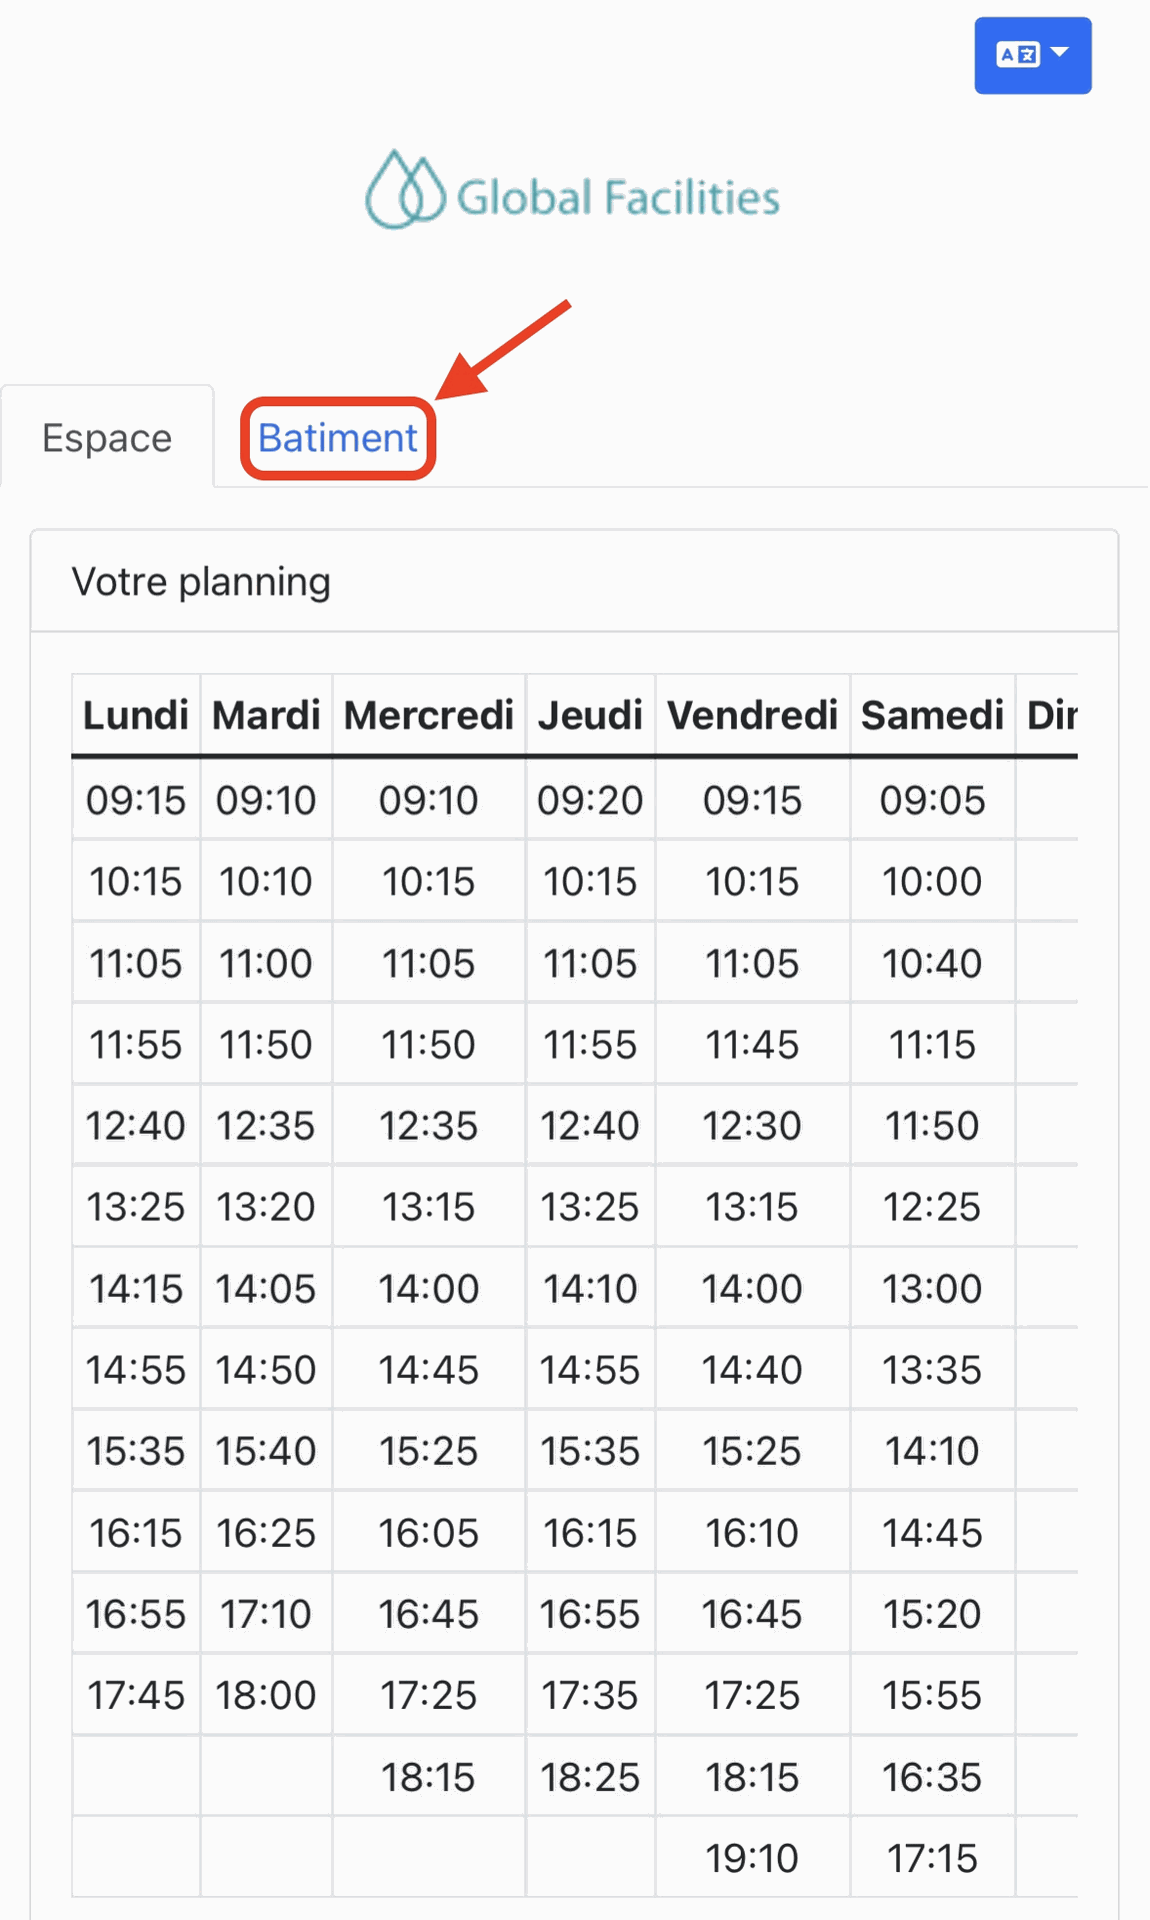
- Click the calendar icon at the bottom left to see upcoming cleaning times for that space.
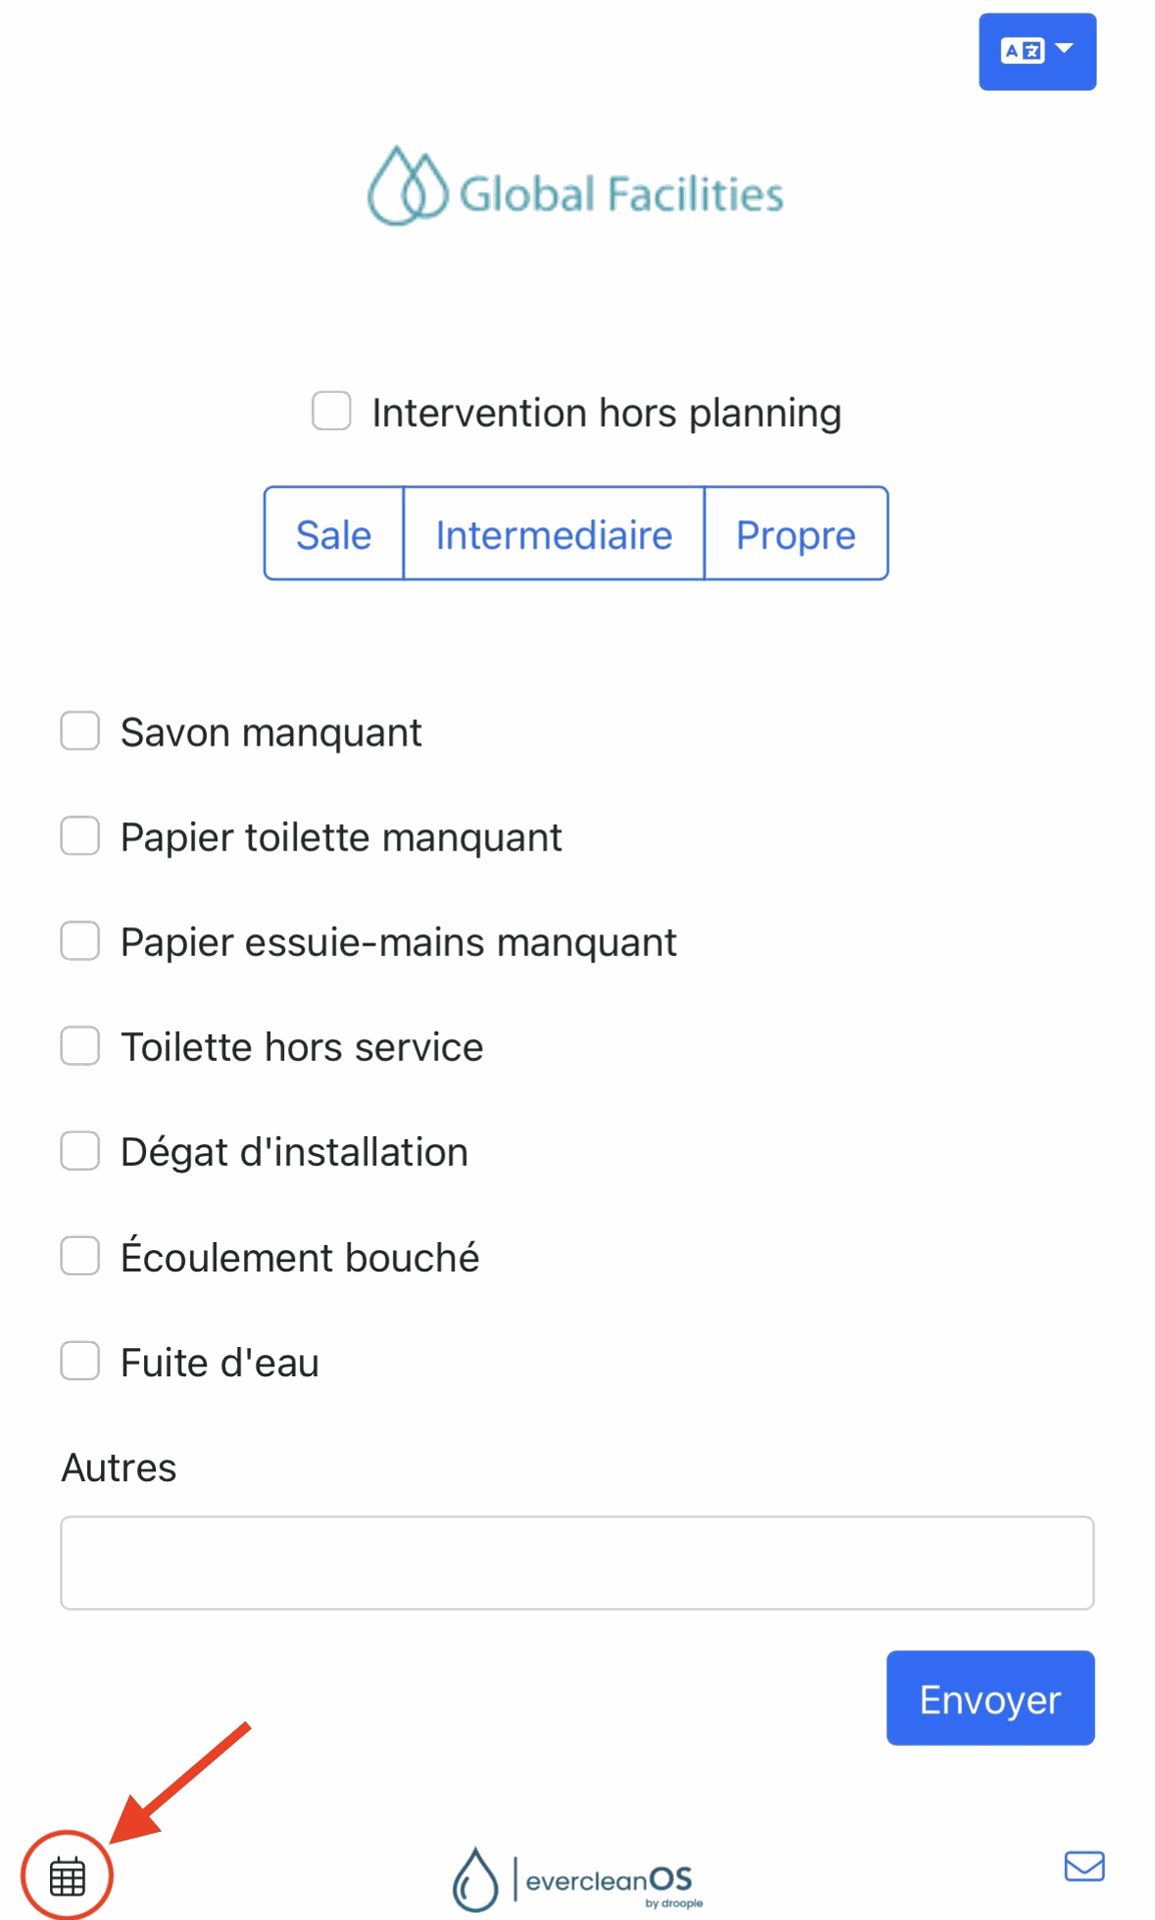
3. To view all spaces under your responsibility, click the 'Building' button.
At Droople, we value our customers’ feedback and strive to enhance our platform continuously. By clicking the button at the bottom-right corner of the platform, you can report any issues or suggest improvements directly through a simple form.
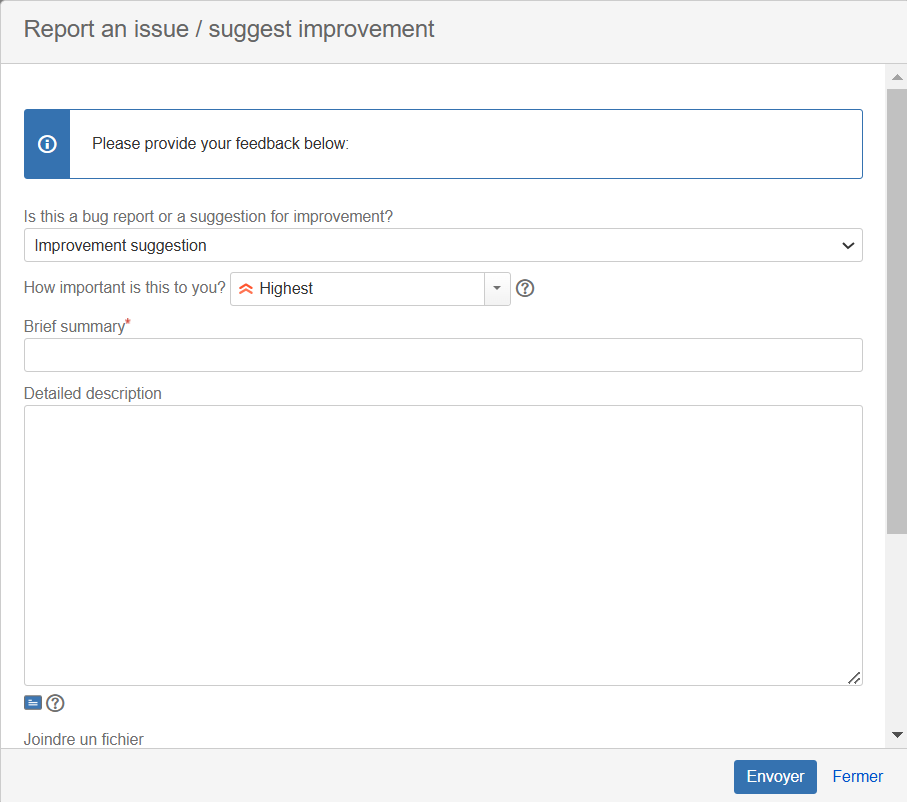
We are committed to listening to our users, and if there is shared interest in implementing a suggested improvement, our team will be more than happy to make it happen. Your input drives our innovation!